While there are ground rules, implementing auditorium music test results still relies on your radio experience (and depends on your programming strategy).
Following part 1 and part 2, we’ll now focus on processing & analyzing auditorium music test (AMT) data to make correct programming decisions based on accurate research interpretations. Guest writer Stephen Ryan explains how to weed through spreadsheets full of output from your radio music research session. ‘It’s a careful judgement song by song.’
‘A sufficient indication of the breadth or dimension of a song is what you need to drive cume’

Playing mass-appeal songs helps increasing your cumulative audience or total reach (photo: Flickr / Tim Kwee)
Expect different song ratings
All diaries have been collected; all data have been processed, so now you’re looking at your spreadsheets, ready to find out where every song currently is in its life cycle. Every auditorium music test produces different dynamics between songs related to those tested in a previous session, as both stand-alone songs and in their relation with others (having different places in the hierarchy). Some songs that have tested well previously (and therefore have been played on a high rotation) may now be showing higher levels of burn (and therefore now end up on a low rotation or inactive position). Some songs that didn’t make it last time due to burn will have had a period of rest, and may prove to be contenders for rotation again.
 Get a good overview
While your consultant can help you wade through your data and highlight salient points, there are some things you can do to help yourself. If you don’t have analysis software, but simply have lots of Excel sheets (usually broken down by various age and Station Music Core cross-tabs), you want to make a single worksheet for all data. This summary should give you a snapshot of the song hierarchy (based on popularity) for your music scheduling.
Think of mass appeal
First, easily sort songs by their appeal across various cross-tabs, in a way that doesn’t fry your eyeballs and brain! You could simply sort by the Favorite score. While it’s a good basic indicator of passion, it won’t give you a sufficient indication of the breadth or dimension of the song, which is what you need to drive cume (total reach). So you need to at least include the Like score. Adding the Favorite and Like score together may give you a form of positive rating, but a high Like score is then given equal weight to a high Favorite score – and you still need to reference the Favorite score to see how strong the song is. You could use a weighted average by multiplying the Favorite score by 2, adding the Like score, and then dividing the result by 3. This will dilute the effect of the Like score toward the Favorite score, but there can still be a noticeable influence from the Like score…
‘Heavier listeners to your station will burn more quickly on your high-rotation songs’

Focusing on your Music Core helps you build your TSL, but might increase some Burn (photo: Republic Records)
Index Favorite, Like & Neutral
The best way is to take the Favorite score x 2, add it to the Like score x 1.5, and add that to the Neutral score x 1. This gives you an index for every song out of 200. The 6-point scale would produce a percentage rating, so if you added the Favorite + Like + Neutral + Burn + Negative + Unfamiliar scores, you would get to 100%. Now, if you are looking at a Total sample, then a Favorite score of 65 for a song would mean that 65% of all people participating in your auditorium music test Like this song. If you’re looking at a sub sample, for example your Station Music Core, then it’s a percentage of that. Once you start calculating an index, this is no longer a percentage, but a number related to the maximum achievable. In this case, there’s a maximum of 200, and any song with a score over 110 is a hit song for your audience.
 Focus on music listeners
Which cross-tab is used as the base-sort column really depends on your strategy. The most important is your Music Core audience. Music Core and P1 listeners are not necessarily the same. There are two categories of people for which your station is their #1 preference: those who are listening to you most for any reason, and those who are listening to you most for music. Your AMT should be focused on people who listen to a station most for music.
Convert ‘cores’ to ‘heavies’
In other forms of research, such as a market study, we would ask two separate questions. First: ‘What station do listen to most (for any reason)?’, and then: ‘What station do you listen to most for music?’. The relationship between the two is really interesting. If the ‘most for any reason’ rating is higher than the ‘most for music’ rating, this normally implies there is a strong ‘personality’ element to the success of this station, often related to a strong morning show. If the ‘most for music’ is higher than ‘most for any reason’ rating, this usually means that the station is very reliant on music for its ratings success, and has no real morning show (or an underperforming one). Music Cores are the biggest fans of your music, and can help you build your Time Spent Listening (TSL). But as they are the heavier listeners to your station, they are also the ones that will ‘burn’ more quickly on your high-rotation songs.
‘Use music genres as filters in your auditorium music test’

You can see which music genre the majority of your audience likes most (photos: KpopStarz, Def Jam Recordings)
Use PNR for negatives
How important is ‘burn’ versus liking or loving a song? Should we include ‘burn’ as well as any negative rating in the index calculation (subtract these negatives from the positives) to create an overall song index?
Burn is very important as a stand-alone figure for reference, but doesn’t need to be included in the index. The same is true of Negative. Remember that the Favorite, Like, Neutral, Burn, Negative and Unfamiliar are percentages that all add up to 100%. So, if there is a negativity issue, the Burn and/or Negative will be high, which brings down the ratings for Favorite, Like and Neutral, so the resultant index score will be lower. You can use a Positive Negative Ratio (PNR) score to check negatives. Here you can add the Favorite + Like (positive scores) and Burn + Negative (negative scores), and divide the positive by the negative, for every individual song. This gives you a guidance score. The lower the result, the more negativity is an issue; the higher the score, the more positive the song is.
 Choose ‘cume’ or ‘core’
How you balance results will depend on many factors, including how successful the AMT has been in finding great songs. You’ll think about how flexible you want your rotations to be, thus how many songs you want in your active universe. Your ‘music core’ could be the base sort column, unless your main goal is building cume. Essential are your Station Music Core (to keep them listening) and your Competitor Music Core (to make them listen to you more).
Correlate genre fan groups
Apart from focusing on your music core vs. cumulative audience, what could be other good strategies to consider or approaches to use when looking at auditorium music test data?
It really depends on what you are trying to achieve, and on the required strategy for the station at this point in time. There are so many permutations. For example, if you are having problems with your TSL, you might want to generate 2 columns of results where you compare light listeners (say 1-3 hours) and heavy listeners (say 4+ hours) to see if there is any noticeable difference in, for example, Burn. If you decided to use music genres as filters in your auditorium music test, you can see how fans of each music genre rate the songs, and see which genre fan group has produced the highest number of top testing songs. You have to cross-relate this to the composition of the music genres in the AMT song list, and to the composition of the song universe for your music scheduling.
‘Look for any excessive polarization across other cross-tabs and age cells’

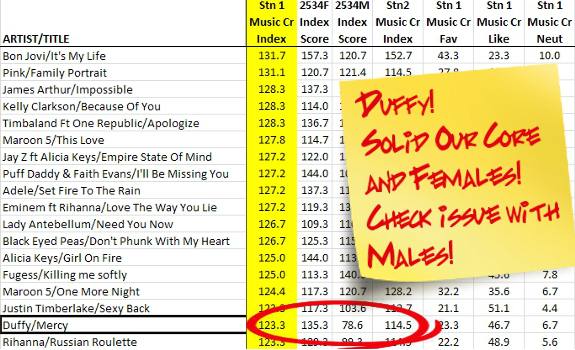
In this fictional example, the Index score for Duffy’s ‘Mercy’ is good with Station 1 Music Core (our own station) as well as with Station 2 Music Core (our main competitor), and it’s very good with 25-34 Females, but it seems that 25-34 Males like it much less; a good reason for a close look at all scores for this song (image: Ryan Research)
‘Sandwich’ your polarizing songs
If there’s a licensing requirement to include, for example, local music, you may see that songs which scored well with fans of this genre cause polarity with fans of other genres. As you have a legal requirement to play them, you will have to schedule your ‘risky’ songs carefully. While your sorting is based on a single cross-tab (as ‘you can’t please all of the people all of the time’), always look for any excessive polarization across other cross-tabs and age cells. When you find a song with significantly different ratings from different parts of your audience, you want to ask yourself whether you really have to play it (on high rotation), such as with the Duffy song in the (mock-up) example above. But there’s no one size fits all. How you approach your analysis depends on the results you received, and what you want to achieve strategically.
 Test relevant songs only
What’s the worst possible mistake in (analyzing) AMT data?
The biggest mistake can happen well before you come to analyze, and that is selecting wrong songs in the context of your playlist. Choose the right titles for your format. If you include Nessun Dorma by Pavarotti, it might test well, but how does it sound coming after a Beyoncé song? Also, you want to avoid unfamiliar music, and only test familiar songs in an AMT.
Ensure reliable sample sizes
You also want to avoid some of the following mistakes, especially in terms of sample size, that I’ve seen when looking at auditorium music test data previously analyzed by someone else, which were given to me by a client as reference:
- Using a too small sample size for a too wide demographic range (e.g. 100 people for a demo of 15-34, which means at best 25 people per 5-year cell, which is below the minimum 30 per age cell)
- Having an insufficient sample size (less than 30 people) for your Station Music Core, and especially making strategic decisions based on this too low sample size
- Making global assumptions on perceptual questions while the sample is quota-based on a specific segment (potentially including already converted people)
- Making too much of Competitor Music Core results based on sample sizes that are too small, and that are therefore unreliable
- Focussing an analysis on one metric, without cross-referencing to other metrics to check for severe polarity
‘If a song’s negative rating reaches or exceeds 20%, it should be removed or reduced’

The issue in this example is with 25-34 Males, and polarization based on a 35.7 Negative. Not visible in this picture: 25-34 Female Negative in this example is 4.0, and Station 1 Music Core Negative is 14.4. In this scenario, ‘Mercy’ should get a lower rotation, as our Station 1 Music Core is a mix of males & females (image: Ryan Research)
Compare ‘Burn’ and ‘Favorite’
At which Favorite / Like / Neutral index rates vs. which Burn / Negative / Unfamiliar index rates should songs usually be put into which categories?
In an ideal world, you would like to attain results that can perfectly fit your ideal category allocation and rotations. In reality, you have to work with the results you receive. As a traditional rule of thumb, if a song’s negative rating (such as Burn or Negative) reaches or exceeds 20%, it should be removed from the playlist or dramatically reduced in its exposure. However, what happens if that only gives you 100 out of 600 songs you can play, and you need considerably more songs than this? You may need to be a bit more flexible, and look carefully at both negative and positive scores. A song might have a 23% Burn, but a 31% Favorite. It’s a careful judgement song by song.
 Use the 110+ rule
Any song in a high rotation should have a minimum score of 110 on a 200 index. If you don’t get enough songs with that level of popularity, you either have to reduce the number of songs in some categories (which will increase the rotation of songs that stay), or lower your threshold (and consider to include some songs below 110). It always comes down to experience and judgement, and what you are trying to achieve strategically.
Follow your market map
Have you ever had an AMT where you learned something about your audience’s music taste that you didn’t expect, where the station was able to make a strategic move that put them ahead of the competition?
You rather don’t want to experiment with auditorium music testing. It’s better to first identify your target audience’s music taste through cluster, format & market studies and then select genres and songs for your AMT according to these results. The song selection for your auditorium music test should be based on knowing which kind of music your audience basically likes — you just want to find out where these songs fit in the hierarchy. This kind of radio music research should follow your format; not design it. You may find that while a music genre is highly popular, a lot of songs within this style are in fact quite burned. Then you make a careful judgement, and balance the popularity of a genre against the reality of what’s available from songs you’ve included in your auditorium music test.
This is a guest post by Stephen Ryan of Ryan Research, edited by Radio))) ILOVEIT | Part 1 | Part 2


Thanks, Antal! Yeah, I agree, the index numbers are very helpful.
Hello!
Great summary, the 110+ rule is a good approach.
Regards,
A