Radio researcher Stephen Ryan shares best practices for a key music research tool of program directors and music schedulers: auditorium music testing.
Following key considerations for auditorium music test vs. callout research based on your station’s music format, we’ll now focus on how to conduct a successful AMT. In this first part, we’ll discuss what to consider when you’re deciding on sample structures and research approach to ensure that you’ll get effective and usable results from your auditorium music test.
“The modern listener has so many options for entertainment”

In a multimedia & multitasking world, holding on to listeners who tune in is key (photo: stock image)
Entertain your respondents well
But isn’t it all a bit… contrived? Those who are not keen on using music research will argue that the whole concept of an auditorium music test is too synthetic with the attendees judging songs in an unnatural environment. Admittedly, a badly conducted auditorium music test will bring back haunting memories of high school and university exams! However, a well-conducted session is where stations provide a fun night out for the attendees. As a respondent, you hear lots of music you like, have a chance to win prizes, have an opportunity to socialize during the midway break, and receive a cash incentive or something of similar value. Every attendee is there because they fit specific criteria, and they provide a snapshot guide to their current opinion of a song on the night of the test.
Define your power songs
You are aiming to take 600 songs you believe fit your format, and allow people to rate them. This allows you to sort them in a hierarchical order, and ensure that songs with continuing high appeal will get most exposure. Lesser songs could then be carefully placed, surrounded and protected by the power of stronger ones. We have explained this in detail in a previous part of this radio music research series.
Drive your station’s TSL
Years of experience and analysis show that a correct interpretation and implementation of results (from a well-executed AMT) can provide dividends to a station during the following ratings period, especially in terms of building Time Spent Listening. The modern listener has so many options for entertainment. Once they switch you on, you want to keep your audience engaged for as long as possible! Strategic music scheduling, using research as a reference, can help you achieve a higher engagement. Careful monitoring of rotations will keep the songs from the auditorium music test popular and fresh for a number of months. However, a follow-up AMT will allow you to check the lifecycle of the active songs, and add some new songs to freshen the music universe.
“Research data can be analyzed and displayed as your AMT progresses”
The ability to analyze data right away is one of the benefits of digital measurement (photo: House of Research)
Include participant validation questions
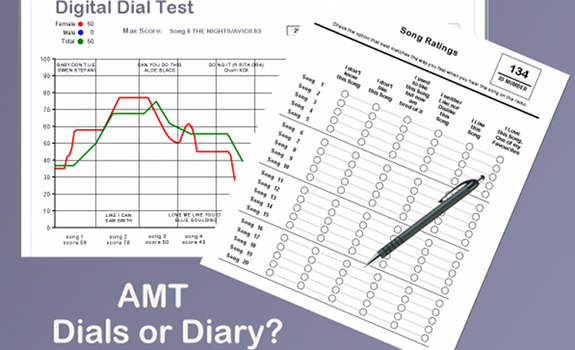
You can choose between using a printed diary or electronic dials: analogue versus digital. The diary is a printed questionnaire where all questions and answer options are listed, which a respondent fills in during the auditorium music test. Including some validation questions (where you’ll ask for people’s age, gender, radio listening habits, Time Spent Listening), testing several music styles, asking a few perceptual questions, and rating around 600 songs will make your diary about 45 pages long. The cost will be the printing of a diary for every respondent, plus additional ones for staff and backup. Then you need to allocate a cost for data entry after the auditorium music test, which is often done by the fieldwork company. The chief downside, though a minor one, is the delay between the conclusion of the AMT and the delivery of the data.
Make diaries user friendly
You can design your diaries to be digitally scanned, rather than processed manually. However, you need to be careful that the need for ‘scanability’ does not overtake the visual appeal of each page. The diary should be uncluttered, and easy to use with the appropriate use of white space. Lines and lines of tiny text with answer options squeezed onto the page are liable to give your respondents a headache…
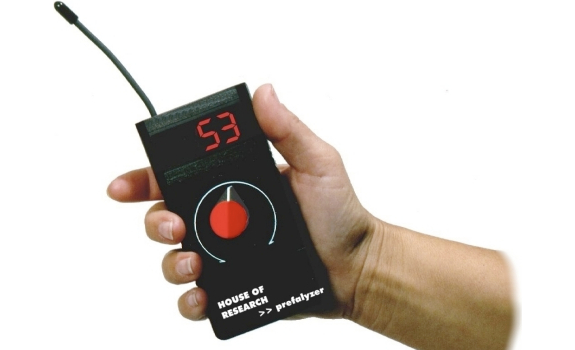
Use electronic measurement benefits
Dials are similar to those you may have seen being used during political TV debates where they produce a graph, indicating the presence or lack of appeal to what’s being said. They can be rotary dials with a scale such as 1 to 100. Most devices also include numerical buttons. Respondents are using these dials to answer questions, and rate songs under instruction of the moderator. While using dials removes the cost of printing diaries and entering data, the cost of the consultant or dial provider will increase proportionally. The key advantage is that research data can be analyzed and displayed as your auditorium music test progresses, and that your consultant can work on and produce first results almost immediately on conclusion of the test (as there’s need to wait for data entry).
“We tend to favor the diary approach”
Using diaries during your AMT might be more engaging for your respondents (image: Ryan Research)
Give people good direction
Diaries and dials each have their respective advantages and disadvantages. Some will argue that dials tell you how positive or negative a song is, but not necessarily why (is it pure negativity or just burn?). Others will argue that it doesn’t matter; a hot song is a hot song, and a poor song is a poor song. We tend to favor the diary approach. This may seem strange where we see an ever-increasing use of digital devices in people’s lives. However, if you design your diary well, respondents tend to engage more. They can read questions themselves as well as hearing what the moderator is saying, and they can easily see a reference on the page to where they are required to focus and how they are to respond. Seeing all the attendees turning over the page simultaneously at the appropriate time is reassuring. There is consistent visual evidence of engagement.
Process your data efficiently
Yes, you do have to wait for the data input, but not for long. An average 45-page diary should be able to be input in about 12 minutes. Allowing for breaks by adding a margin of 25%, and even if you have sample of 150 people, this will take 38 hours. Divide this work across a few people, and there won’t be much of a delay in delivery of the data. So that should not be a main reason to choose electronic measurement.
Invite additional AMT attendees
We touched on the ideal research sample and its composition in a previous article. The number of potential permutations of the sample structure is considerable, and needs to be looked at on a case-by-case basis. Here’s a thought process you can go through when considering your proposed sample structure. As mentioned in that article, an absolute minimum sample is 30, and you actually want to have a minimum of 35 people in each data cell that you want to assess in isolation. With an auditorium music test, there’s always the question of who actually turns up on the night. So you need to build in extra margin to allow for ‘no-shows’, unless your fieldwork company is contractually obliged to fulfill your exact quotas.
“100% should have listened to your station in the last 7 days”

Each and every participant in your auditorium music test should be a current listener (photo: stock image)
Guarantee enough people ‘showing’
The cost of providing your ideal sample firstly depends on the size of it, and secondly on the filters for the recruitment. Large samples combined with hard criteria will ensure you receive an expensive invoice. We previously explained how just a small set of filters may result in thousands and thousands of telephone calls. Keep in mind that once contact is made with an eligible participant, they won’t complete your survey right away. You’re inviting them for a future session at a certain location. Even keen and receptive respondents who fit all criteria may face lifestyle issues that can affect their ability to attend after all. The fieldwork company should have the appropriate experience to calculate the potential attrition rate and suitably ‘over recruit’ to ensure the right number of respondents will turn up on the night of the AMT.
Define your research demographic
Most stations will have a primary format target based on a 10-year age span. Using a minimum sample of 100 people, you can look with confidence at data for 2 x 5-year age spans (with 50 people in each). However, if this is male- and female-based, you end up with just 25 males and 25 females in each span – while, as mentioned, an absolute minimum (in each cell or cross-tab you want to analyze separately) is 30 people.
Include your competitor’s listeners
We have previously discussed how using a solely female-based sample for your music research an still produce usable and effective data, even where a large proportion of your listenership is male. However, sample structure is not just about age and gender. You should also think about your sample’s listening habits:
- 100% should have listened to your station in the last 7 days
- 50% should have you as their station to listen to most for music (your ‘music core’)
- 50% should be made up of listeners to stations that compete directly with you on format, e.g. 30% ‘music core’ of your primary format competitor, and 20% ‘music core’ of your secondary format competitor (or an amalgam of minor, but still important, competitors)
If you are in the top tier of listening share in your market, your ability to achieve these listening quotas will be much easier than for lower-rating stations. If you are in the middle to lower tier, then you will have to modify your expectations considerably.
“The most important consideration is how far down you will be able to dig into your data”
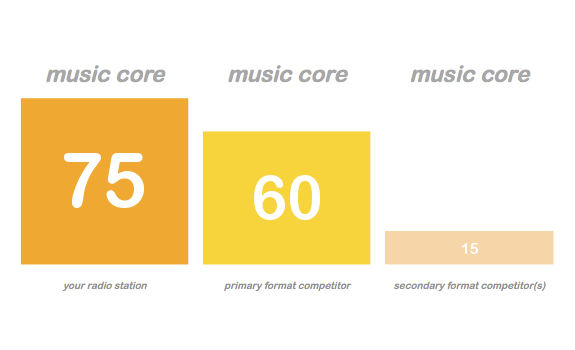
Focus your sample on your music core, and that of your main format competitor (image: Thomas Giger)
Reverse-engineer your research population
The most important consideration in deciding on your sample structure is how far down you will be able to dig into your data. First, look at the smallest criteria you wish to examine (with a minimum of 30 people) and then work backwards to see how achievable and realistic your expectations are. Usually, you will need to compromise, and start again with less expectation. Start with your minimum goal (30 people) as this will be the smallest percentage group you will look at. Having done your initial calculations, you can always upscale the quota for the smallest group.
Multiply a smaller section
For example, let’s say your format target is females between 20 and 29 years (which is that 10-year span), and you want 20% of our ‘competition music core’ to be fans of the music that one of your minor format competitors is playing. You need to allocate at least 30 people within a smaller sub section (like this 20%) and see what implications it has on the total sample size and other important criteria. Having allocated 20%, you can now work backwards.
Maximize your sample efficiency
If 20% is consisting of 30 x 20-29 females (‘music core’ of minor format competitors), then 30% is consisting of 45 x 20-29 females (‘music core’ of main format competitor), and 50% equals 75 x 20-29 females (‘music core’ of your radio station). It gives you a sample of 30 + 45 + 75 = 150. Do you make the best use of your sample this way? You could compare 20-24 females vs. 25-29 females for your own ‘music core’ (as 75 / 2 = 37 or 38 people in each 5-year cell, which is over the absolute minimum of 30, and even over the ideal minimum of 35 people). But you could not split the ‘music core’ of your main format competitor into 2 x 5-year cells, as this sample part includes only 45 people (and 45 / 2 = 22 or 23 people in each cell). Do you prefer a bigger sample of your main format competitor, and just a flavor of your smaller format competitors? Then start the calculation again, using the quota for your main competitor as the basis for that part of the sample in your auditorium music test.
This is a guest post by Stephen Ryan of Ryan Research, edited by Radio))) ILOVEIT | Part 2 | Part 3


Add Your Comment