If you run a music station, your music fans are driving your ratings, so your callout research should be focused on your P1 nucleus (and that of your main competitor).
Following a 3-part article on auditorium music testing, radio research specialist Stephen Ryan was kind enough to also share best practices on how to do callout research the right way. Being on top of your (and your main competitor’s) Music Core is essential to spot music preferences regarding current and recurrent songs. But how to recruit a reliable sample for your callout research, even if you’re not a heritage brand? It’s one of the questions answered in this guest post.
‘Don’t end up with ‘light’ radio listeners’
Choose participants who listen to radio for 15 minutes a day or more (image: Thomas Giger)
Test your (re)current songs
In previous articles in this series, we have seen how tighter research budgets have meant that programmers often need to decide and focus on the best music research methodology for their radio format. In recent articles, we looked at best practices in the recruitment, execution and interpretation of an auditorium music test. An AMT is best suited to formats that are more heavily reliant on gold songs, while callout research is most fit for formats where current & recurrent songs tend to dominate the playlist. While an auditorium music test is a snapshot of a song’s popularity at a particular point in time, callout research helps you to get an ongoing trend indicator for the life cycle of a song, from its initial exposure to peak rating to then popularity decline (normally through ‘burn’, where listeners are getting tired of a song). As with an AMT, you’re looking for a hierarchy for songs tested. However, for callout, that hierarchy will be dynamic.
Guarantee your answer quality
Traditionally, callout research has been CATI (Computer Assisted Telephone Interview) based. The panel is initially recruited based on quota criteria. Then, on a regular basis throughout each month, a subsection of the panel will be called for each survey (normally referred to as a ‘wave’). It’s good to test a maximum of 30 songs per call. Keeping in mind that a panellist will listen to song hooks through a telephone handset, it was found that they can tolerate listening to about 30 songs in one session while retaining their full concentration.
Set your TSL minimum
We’ll discuss online research in a later article, but it’s interesting to note that the current recommendation for a survey conducted on a mobile or tablet device is a duration of 7-8 minutes. If you have 30 song hooks, plus validation questions (to define factors like gender, age, TSL, cume, and ‘music core’ listening), this equates to about 7-8 minutes, so it looks like the 30-song rule will live on in the digital age. To ensure that you don’t end up with ‘light’ radio listeners, you always want ask a Time Spent Listening related question as part of your recruitment filters, and set at a minimum of 15 minutes a day (or even up to one hour a day). If you accept ‘light’ radio listeners in your panel, you may not get a true picture of ‘burn’ for the songs tested.
‘The compilation becomes quicker and more efficient’
Using re-validated panelists several times saves you time and money (image: Ryan Research)
Limit your recruitment costs
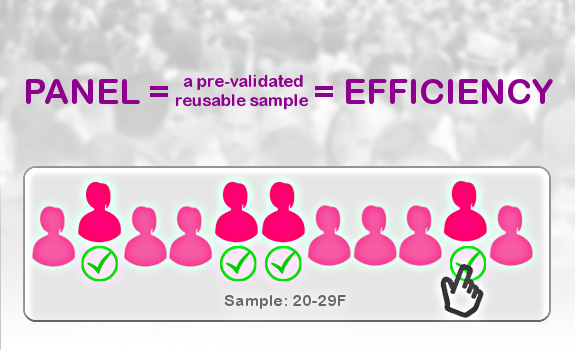
Beginning your panel construction prior to commencing any callout waves means that the heavy lifting is done at the start. When your panel has been built correctly, then by definition the compilation of the sample for each wave becomes quicker and more efficient because you are dipping into a pre-validated pool. You can use each member of the panel several times, thus saving on the cost of having to find new people based on your recruitment criteria for every wave. The initial panel build (and the actual callout conversation) should remain blind. The quotas are built along set criteria, but your participants should not be aware of why they’re being recruited, other than you’re interested in their view on songs as a radio listener.
(Re)validate your panel members
As large local and international fieldwork companies have access to large proprietary databases, there is a growing trend toward moving away from a panel build, and recruiting the required sample as each wave is required. Others still favour the recruitment of a panel to get multiple chances to validate the respondent, firstly when they are initially recruited, and then always before they are invited to a survey. Whether you want to use a panel or live recruitment for each wave depends on budget, but the composition of the sample and the consistency of that composition are key in generating solid and reliable data. If you want to see trends, you need consistency.
Leverage your (P1) audience
Later, we will outline how to build an initial panel if you’re a new station (or recently flipped format), or if you don’t have a sufficient audience base to build an appropriate sample. For now, we’ll assume that your station does have some heritage, and a quantifiable audience. This normally means that it’s included in official audience ratings, and that you have access to your radio station’s ratings data. It helps the fieldwork company to calculate the cost of recruitment. It goes without saying that, if you are not in the top tiers of the ratings, this will have a significant impact on the cost of your fieldwork in case recruitment criteria are based on ratings.
‘Try and have a usable sample of both males and females’

But if you have a limited budget, you could use a 100%-female sample, unless your station’s music format is specifically targeted towards a male audience (image: Flickr / Yu-Jen Shih)
Maintain your trend consistency
Your focus should be on a 10-year demographic, which represents the target audience — leave the sales target to the sales people. As callout research is most efficient for music formats with a high level of Currents & Recurrents, that 10-year demo will lean toward young adults (20+), and potentially teens. When you rely on consistent trends, young adults are the ones providing consistency. If you do intend to (or need to) include teens in your research, include at least an equal amount of young adults. Teens go hot or cold on songs very quickly. While in particular male teens can help you spot potential future hits, check the more consistent views on songs provided by young adults. This way the real hits will have a longer lifespan.
Review your future 20+ers
We often hear how teenagers are listening less to radio (even if usually in terms of TSL, instead of not listening at all). It is important to remember that today’s teens will also grow into young adults — and when they do, they may take their behaviour patterns with them. It means that in the future, the consistency currently provided by young adults may then become less so. That is something you will need to monitor then, but for now, those 20-plusses still provide that necessary balance.
Spend your budget efficiently
When we refer to teens, this would normally be those aged 15-19 years, but keep in mind that laws about using young people for research will vary from country to country. Check with your fieldwork company if there are legal restrictions imposed on your market. As explained in How To Make Your Auditorium Music Test Count, it’s good to know that you can usually focus solely on females — even if your actual format also appeals to males. Obviously, there are certain formats that are considerably male oriented, and for those, this ‘female rule’ does not apply. Ideally, you should have a usable sample of both males and females, but in case you’re working within tight budgets, this simply may not be feasible. For this article, we will use an example of callout based on 20-29 year-old females.
‘Only reduce the sample for Other Competitor(s) Music Core’
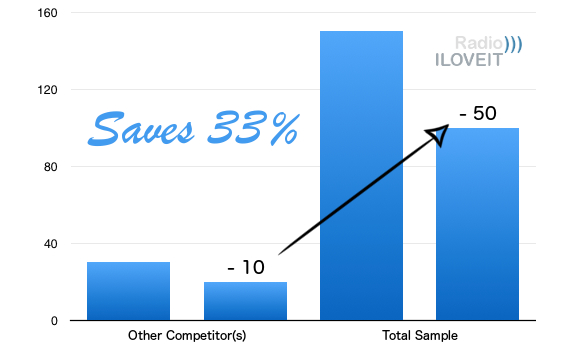
Just reducing your Other Competitor(s) Music Core from 30 to 20 allows you to decrease your total sample from 150 to 100, potentially saving you 33% of your budget (image: Thomas Giger)
Make your research reliable
Before looking at the most effective panel size, you need to decide about the required sample size for each wave. In a previous article, we outlined a strategic approach to decide on the composition of the sample for an auditorium music test. There is a common thing with callout, which is that you want to have an absolute minimum of 30 people in any cell or cross-tab that you want to look at in isolation. An AMT is open to who actually turns up during test night, so an over-recruitment is required. This is not the case for callout, so you don’t need to over-recruit to hit your sample target. Regarding composition, the ideal one (for the overall panel, and for each wave) is this:
- 100% of the sample should have listened to your station in the last 7 days
- 50% of the sample should have your station as their ‘station to listen to most for music’
- The remaining 50% of the sample should include one or more stations, with the same (or with a similar) format as you, that compete directly with you on the position of ‘station to listen to most for music’, like 30% Music Core of your main competitor, and 20% Music Core of either your second-biggest competitor (or an amalgam of several minor, while still significant, competitors)
Include your competition’s core
The decision is really based on your individual market competition. If you want to break out the Other Competitor(s) Music Core (so either that single secondary competitor, or an amalgam of secondary & tertiary competitors), that group will need to include a minimum of 30 people. If they are 20% of your total sample, then 30% (your main competitor’s contribution) will be 45 people, and your own station at 50% will be 75 people. That’s a total sample of 150 people.
(Shrink your sample size)
Should 150 people be too expensive compared to your music research budget, then something needs to be sacrificed. Initially, try to maintain the sample levels for your Station Music Core and Main Competitor Music Core, and only reduce the sample for your Other Competitor(s) Music Core. While you will not be able to look at your secondary and/or tertiary competitors in isolation, you can look at your Main Competitor Music Core and at a combined Main Competitor and Other Competitor(s) Music Core (where at least you see an influence from those other competitors). That combined cross-tab is sometimes referred to as Disloyal Cume. Reducing the Other Competitor(s) Music Core sample to 20 people (which is 20% of the total sample size) will drop the total sample size per wave to 5 x 20 people = 100 participants.
‘The wider the gap, the larger the panel’
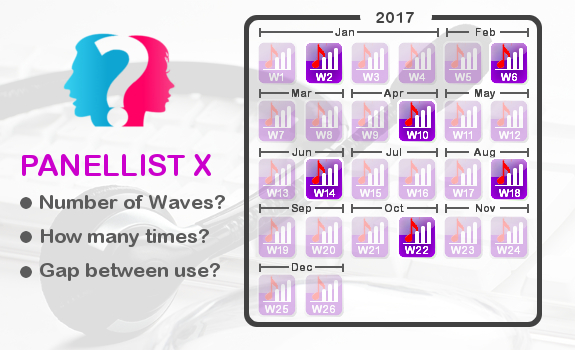
More time between different waves for one participant means higher cost (image: Ryan Research)
Check your sample consistency
Once you have chosen the sample size for each wave, the next cost implication is how many waves there will be in the year. As budgets began to get squeezed, a lot of stations dropped from what would have been 40-44 waves of callout a year to about half that amount, and moving toward having a wave on each alternative week. Let’s say you want 26 waves across a 12-month period. When starting with a new panel, have some waves across consecutive weeks, just to have a chance to check the consistency of your samples before moving to one wave every alternative week. In this example, we have 150 people in each sample (for each wave) based on our composition quotas, and 26 surveys across the year.
Make your choices practical
Another cost implication comes from 3 criteria:
- how many times you will use a single panellist before he or she is retired
- how many waves must be passed before that single panellist can be re-used
- which margin is required to cover the attrition (loss) of panellists across the year
You want to take a pragmatic decision on how many times a particular panellist is allowed to be used before being retired. The fewer times you are prepared to use one and the same panellist, the greater panel (and the higher cost) you will have. Your fieldwork company should be able to guide you on a realistic number.
Rotate your participants strategically
Next, you need to decide how long a panellist will be rested between their involvement in one survey and the next. You want to put the emphasis on the period of time between surveys, rather than the number of surveys. Think of it this way: if you set it at a 4-survey gap and you are doing weekly callout research, a panelist would be used once a month. But if you are doing callout sessions every alternate week, then a panelist would be used once every 2 months. Also, keep in mind that the wider the gap for a single panellist between one survey and the next, the larger the panel for your music test — and, again, more people means additional cost.
‘Avoid using ‘semi-professional’ respondents’
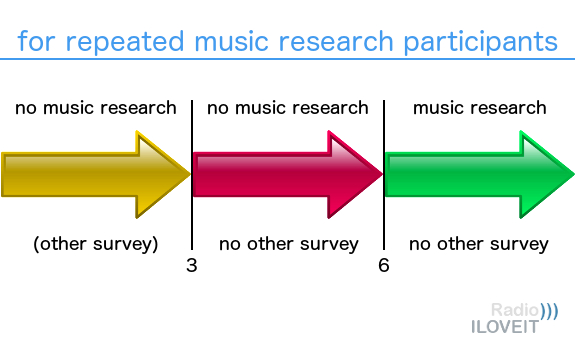
Only include respondents who were not part of any music research over the last 6 months, and who also did not participate in any other survey over the last 3 months (image: Thomas Giger)
Consider your panel attrition
There is one main factor that is out of your control, which is the attrition (or loss) of panellists. Today’s overall lower tolerance for market research will make some panellists leave early on their own volition, so factor in an extra margin in the total panel size to accommodate this. Before, you may have been okay with 20%, but today, you’re likely to need a much higher margin. We mentioned earlier that you could reduce costs by doing live recruitment (using proprietary databases) for each wave, rather than first building a panel. With currently growing attrition rates, the advantages of revalidating and re-using each panel member may become outweighed by the pure cost of building that panel.
Determine your research population
Once your various parameters are set, you can calculate the required panel size. Based on a 150 sample per wave, 26 waves, and 4 week gap between them, and on using each panellist 5-6 times with a reasonable margin for attrition, you are likely to require a panel of about 1.000 people. If we had based our calculations on a 100 sample per wave, then the total panel size would likely be around 700 people. Your fieldwork company should be able to advise you on your own market considerations.
Ensure your panel freshness
Similar to auditorium music test recruitment, if you let your fieldwork company use an existing database instead of recruiting people who’ve never been part of any of their surveys, make sure that they don’t enlist participants who have been regular survey respondents in the recent past. As always, you want to avoid using ‘semi-professional’ respondents. It is worthwhile making some additional stipulations, like that no respondent has been used in any kind of survey in the last 3 months, and that no participant has been used for any kind of ‘radio’ and/or ‘music’ research over the last 6 months. Especially if a participant is to be used on a repeat basis for music research, you want to add criteria for ‘how many’ and ‘how often’ as outlined above.
‘Seeing the viewpoint of people who listen to you most’
Monitoring your (P1) Music Core is essential in callout (image: 123RF / blankstock, Thomas Giger)
(Include your future audience)
There is one drawback of building a panel. The recruit is based on a set of criteria that is then set for whole duration of research (like 26 waves in this example). This is not helpful if you are a new station, or if you have flipped format recently, because you don’t have an established quantifiable audience base yet. Changing the criteria midway through can prove expensive. In these scenarios, using a live recruit across each wave may be the better option where it would be easier to change the criteria in gradual steps as your audience hopefully grows. At the beginning, you could set a music filter based on your format as your main criterium (either to include those music fans you do want, or to exclude those music fans you don’t want). You can combine it with a quota for your Main Competitor Music Core; your biggest competitor’s music fans of which you wish to attract a part to your station.
(Increase your Music Core)
Using a music filter can also be cost effective if your station is currently on the lower end of the ratings. As mentioned before, the biggest drawback of not having a solid sample of your Music Core is that you don’t get a true indication of ‘burn’ on the songs from people who listen to you most. They are the people who will likely notice your rotations. Getting those rotations wrong can have a detrimental affect, especially on your Time Spent Listening. If you need to start with an alternative filter, such as music genre, then move to recruiting a decent sample of your Music Core listeners as soon as possible. In the next article in our radio research series, we’ll look at some best practice in deciding which songs to test in callout research, and how to approach the interpretation of callout results on each wave.
This is a guest post by Stephen Ryan of Ryan Research for Radio))) ILOVEIT
Header image: 123RF / macrovector, Thomas Giger





Add Your Comment